Advertisement
)
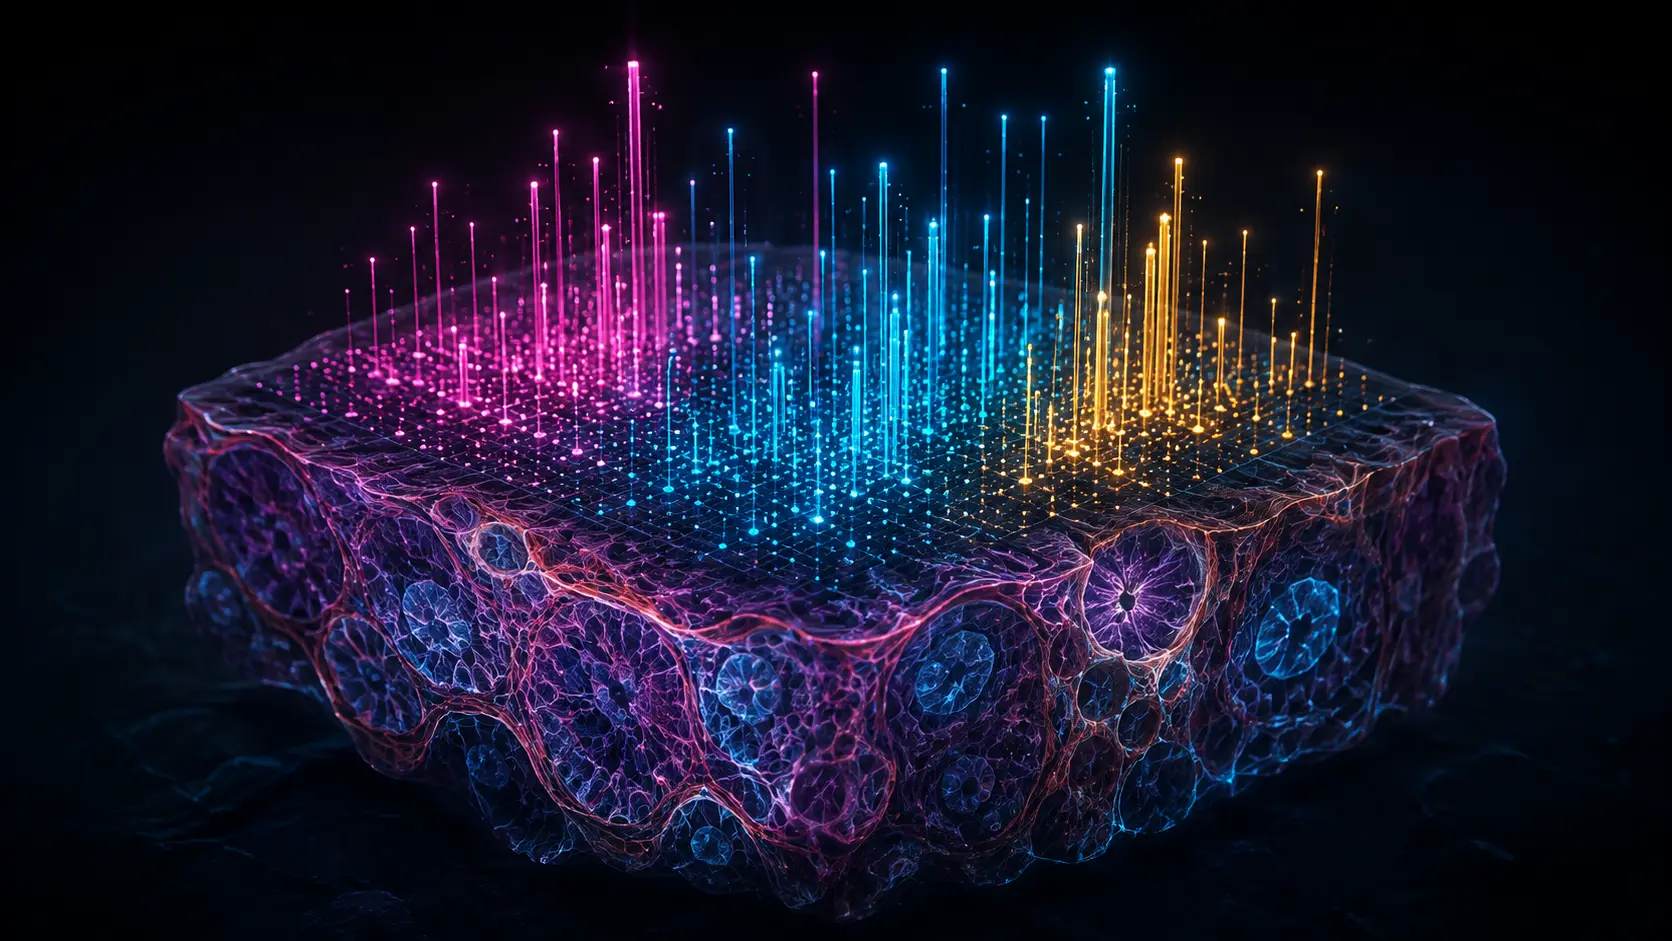

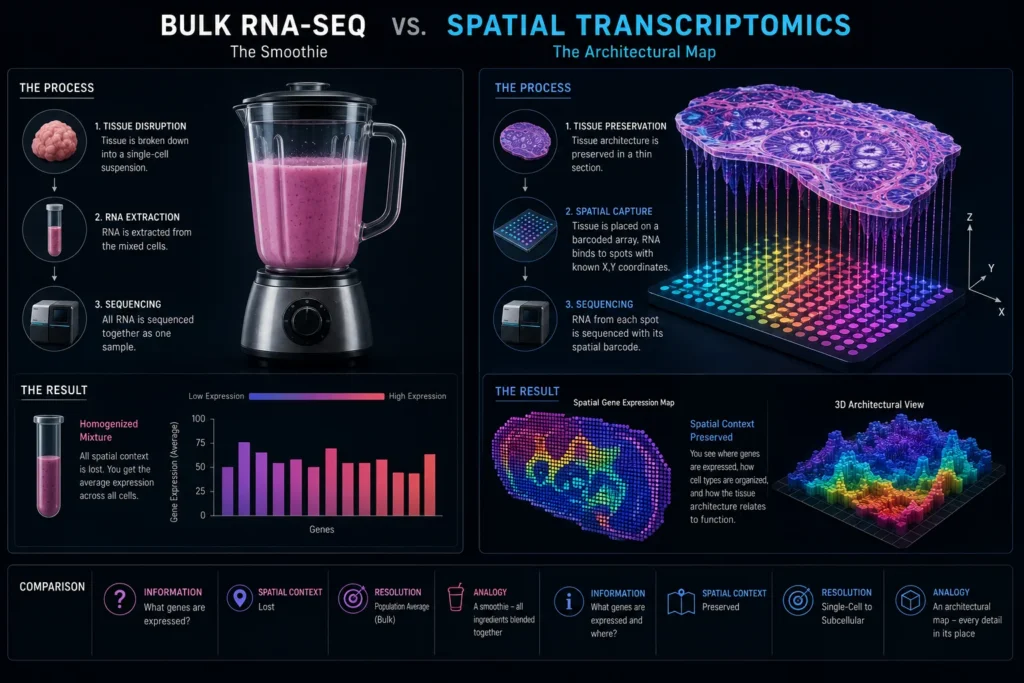
If you want to understand how a complex machine works, you don’t throw it into a blender and analyze the metallic dust. You take it apart carefully, examining exactly where each gear, wire, and bolt is placed. Yet, for the last two decades, the global biotechnology industry has been trying to cure cancer by putting tumors in a blender. Traditional genomic sequencing crushes millions of cells together into a biological smoothie. Scientists can see exactly which cancer genes are present in the mixture, but they completely lose the map of where those genes were originally located.
This massive spatial blind spot is why so many promising cancer drugs fail in clinical trials. Tumors are not just random piles of mutated cells; they are highly organized, microscopic fortresses. Cancer cells actively recruit healthy blood vessels for food and build chemical walls to block immune cells. Why should you care right now? Because a radical new technology has finally given scientists a high-definition GPS for the human body. By mapping the exact 3D coordinates of billions of RNA molecules inside intact tissue, researchers are finally seeing the tumor’s fortress in its entirety, triggering a multi-billion dollar revolution in how we diagnose and destroy incurable diseases.
What is Spatial Transcriptomics?
Spatial transcriptomics is an advanced molecular profiling technology that maps the exact physical locations of gene expression (RNA) within intact tissue samples. By combining high-resolution microscopy with next-generation sequencing, it allows scientists to observe exactly which genes are active in specific cells without destroying the tissue’s structural architecture.
At a Glance
- Concept: Merging histology (looking at tissue structures under a microscope) with genomics (sequencing DNA/RNA) to create a visual, molecular map of a disease.
- Why it matters: Immunotherapies only work if immune cells can physically touch the cancer cells. Spatial mapping reveals the physical barriers and chemical signals preventing immune cells from infiltrating the tumor core.
- Who uses it: Elite genomic research institutions, pharmaceutical companies developing targeted oncology drugs, and spatial biology tech giants (10x Genomics, NanoString, Bruker).
- Biggest takeaway: Spatial transcriptomics generates an overwhelming amount of data. A single tissue slide can produce terabytes of spatial data, shifting the primary bottleneck of biology from chemical extraction to artificial intelligence and bioinformatics processing.
In Simple Words
Imagine trying to understand the politics of a massive city by reading a single list of everything its citizens said on a given day. You would know that people are talking about “traffic” and “crime,” but because the list is completely scrambled, you wouldn’t know if the wealthy neighborhoods or the poor neighborhoods were saying it.
This is Bulk RNA Sequencing. It gives you an average of what the cells are doing, but no context.
Now imagine looking at a glowing, interactive satellite map of that same city. You can zoom in on specific streets and see exactly which houses are complaining about traffic in real-time, and see how that relates to where the highway is physically located.
This is Spatial Transcriptomics. Scientists take a thin slice of a tumor, lay it on a specialized glass slide, and use chemical barcodes and glowing probes to light up the RNA. Instead of a scrambled list, they get a perfectly preserved map. They can look at a specific cancer cell and see exactly what signals it is sending to the healthy immune cell standing right next to it.
Why This Matters
The pharmaceutical industry is facing an efficacy crisis in immuno-oncology. Drugs like Keytruda and Keytruda (checkpoint inhibitors) are miraculous, but they only work for roughly 20 to 30 percent of patients. For the rest, the tumor microenvironment somehow suppresses or blocks the immune system, but traditional sequencing cannot explain how or where the blockage occurs.
For biotech investors and oncology researchers, spatial transcriptomics is the key to unlocking the remaining 70 percent of non-responders. By mapping the Tumor Microenvironment (TME), drug developers can identify the exact spatial layer where T-cells become exhausted and design new “combination therapies” specifically engineered to breach that physical barrier. The spatial biology market is projected to reach several billion dollars by the late 2020s precisely because it transforms drug discovery from a game of biological averages into a game of targeted, spatial architecture.
The Spatial Biology Market: NGS vs MERFISH
Spatial transcriptomics was named “Method of the Year” by Nature Methods in 2020, but the mid-2020s mark its true commercial maturation.
The industry is currently divided into two distinct technological camps fighting for dominance.
- Next-Generation Sequencing (NGS)-based spatial profiling: Pioneered by companies like 10x Genomics (Visium). It is excellent for capturing the entire transcriptome (all 20,000+ genes) across a large piece of tissue, but historically lacked single-cell resolution.
- Imaging-based spatial profiling (FISH): Techniques like MERFISH (Multiplexed Error-Robust Fluorescence in situ Hybridization). It uses fluorescent microscopes to read genes directly inside the cell. It offers incredible sub-cellular resolution, but can typically only track a few hundred to a few thousand specific genes at a time.
The holy grail of the industry—which leading platforms are racing to achieve—is merging these capabilities: capturing the entire transcriptome, across whole tissues, at perfect single-cell resolution, in 3D.
How Spatial Transcriptomics Works
Extracting spatial data from a microscopic slice of tissue without destroying it requires a brilliant fusion of microfluidics, optics, and genetic barcoding. Here is the first-principles breakdown of the NGS-based approach.
1. The Fundamental Problem: Loss of Coordinates
To sequence RNA (the messenger molecules that tell a cell what proteins to build), scientists normally use chemicals to dissolve the cell membranes. The moment the membrane dissolves, the RNA floats away into a liquid tube. You can sequence the RNA, but its original X and Y coordinates on the tissue slide are lost forever.
2. The Insufficiency of Traditional Microscopy
Pathologists have used H&E staining for over a century to look at tissue structure, and immunohistochemistry (IHC) to stain one or two specific proteins. However, microscopes rely on light spectrums; you cannot physically stain and distinguish 20,000 different genes simultaneously using visible colors.
3. The Core Mechanism: The Spatially Barcoded Array
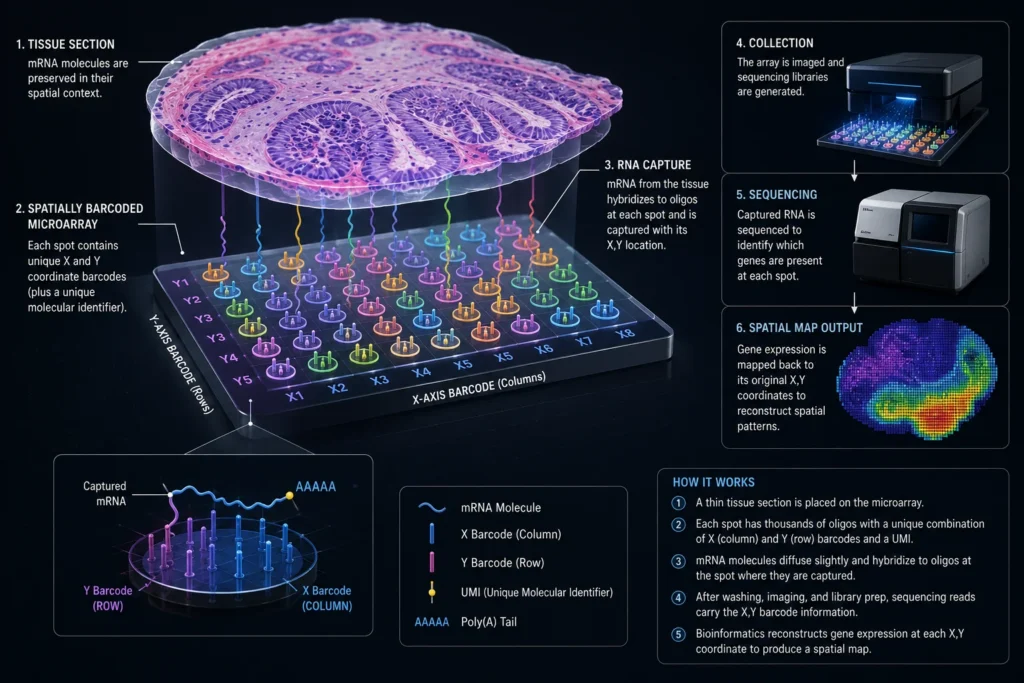
To solve this, scientists created a specialized glass slide covered in millions of microscopic dots. Each dot contains millions of tiny, synthetic DNA strands. Crucially, every strand on a specific dot contains a unique “Spatial Barcode”—a genetic zip code that uniquely identifies that exact X,Y coordinate on the slide.
4. Technical Depth: Permeabilization and Capture
A frozen or formalin-fixed paraffin-embedded (FFPE) slice of tumor tissue is placed directly on top of this barcoded slide. Scientists apply an enzyme to gently poke holes (permeabilize) the cells. The RNA falls out of the cell and drops straight down onto the slide. The RNA immediately binds to the synthetic DNA strands on the dot directly beneath it, physically locking the RNA to the “Spatial Barcode.”
5. Real-World Consequences: Computational Reassembly
The scientists then wash the tissue away, collect all the barcoded RNA, and run it through a standard sequencing machine. The sequencer spits out millions of data lines that say: “Gene X was found attached to Spatial Barcode #4592.” A computer algorithm takes all these barcodes and digitally rebuilds the tissue on a screen, painting a high-resolution, color-coded map of exactly where every single gene was firing before the tissue was destroyed.
Mapping the Tumor Microenvironment (TME)
Spatial transcriptomics has migrated from basic anatomical research into applied, disease-modifying clinical R&D.
Deconstructing the Tumor Microenvironment (TME): Solid tumors (like pancreatic or breast cancer) surround themselves with a fibrous stroma—a dense wall of tissue. By applying ST, oncologists map exactly where T-cells (immune attackers) get trapped. If the spatial map shows T-cells actively expressing exhaustion genes strictly at the stroma border, pharmaceutical companies can design drugs specifically targeting the fibroblasts building that wall, tearing it down so the immunotherapy can breach the core.
Mapping Neurodegeneration (Alzheimer’s Disease): The brain is the most spatially complex organ in the body. Using spatial transcriptomics, neuroscientists map the tissue surrounding Amyloid-beta plaques in Alzheimer’s patients. They can see exactly how microglial cells (the brain’s immune cells) change their gene expression based on their physical distance from the plaque—e.g., cells 10 micrometers away act radically differently than cells 50 micrometers away, identifying new targetable pathways to halt plaque formation.
Developmental Biology and Organogenesis: To understand how organs form, researchers use ST to map human embryos across different stages of development. By rendering these 2D slices into 3D models, they create a temporal and spatial atlas of exactly when and where specific stem cells differentiate into heart, liver, or brain tissue, providing the foundational blueprints for lab-grown organ regeneration.
Economic & Strategic Impact
The spatial biology ecosystem is highly consolidated, driven by aggressive M&A (Mergers and Acquisitions) and fierce intellectual property litigation.
Companies like 10x Genomics recognized early that spatial context was the inevitable successor to their dominant single-cell sequencing business. To secure their moat, they executed massive acquisitions (buying Spatial Transcriptomics in 2018, ReadCoor, and Cartana) to consolidate both NGS-based and imaging-based patent portfolios.
This IP hoarding has triggered brutal legal wars. 10x Genomics and NanoString Technologies engaged in years of high-stakes patent infringement lawsuits over spatial profiling technologies, a legal battle that severely impacted commercial deployments and culminated in NanoString filing for bankruptcy reorganization in early 2024 (subsequently being acquired by Bruker). For biotech investors, this underscores a critical reality: in the spatial biology market, the strength of the patent portfolio is just as critical to a company’s survival as the resolution of their sequencing chemistry.
Advantages
- Preserves Tissue Architecture: Allows researchers to analyze cellular communication and neighborhood dynamics exactly as they exist in the living body.
- Unbiased Discovery (NGS methods): Can sequence the entire transcriptome simultaneously, allowing scientists to discover novel, unexpected gene pathways they weren’t explicitly looking for.
- Identifies Rare Cell Subpopulations: Bulk sequencing dilutes the signal of rare cells. Spatial mapping pinpoints exact pockets of drug-resistant clones hiding within a predominantly benign tumor mass.
Limitations
- The Resolution vs. Scale Trade-off: Currently, you must choose. NGS-based methods can scan massive tissue sections but struggle to achieve true single-cell resolution (often capturing 5-10 cells per “dot”). Imaging-based methods (MERFISH) achieve sub-cellular resolution but can only scan very tiny areas of tissue and look for a pre-selected list of genes.
- Astronomical Data and Compute Costs: Processing a single spatial experiment generates massive, complex datasets. Analyzing and visualizing this 3D data requires elite bioinformatics talent, high-performance cloud computing clusters, and advanced AI—capabilities that most standard clinical hospitals simply do not possess.
- 2D Constraint: Most spatial transcriptomics is performed on incredibly thin 2D slices of tissue. Creating a true 3D map requires slicing an organ hundreds of times, sequencing every single slice individually, and digitally stacking them—a process that is currently too expensive and laborious for high-throughput screening.
Common Misconceptions
Misconception: Spatial Transcriptomics is just a better microscope.
Reality: A microscope uses light to show you the physical shape of a cell. Spatial transcriptomics uses genetics to show you the instruction manual the cell is actively reading. It provides molecular data, not just visual data.
Misconception: Single-cell sequencing (scRNA-seq) already solved this problem.
Reality: Single-cell sequencing isolates individual cells, but the process of isolation destroys the tissue. You know what each cell is doing, but you have no idea if Cell A was sitting next to Cell B or Cell Z. Spatial transcriptomics puts the puzzle pieces back together.
Misconception: Doctors use this to diagnose patients in hospitals today.
Reality: While it is a revolutionary R&D tool for drug discovery, it is currently too slow, expensive, and computationally heavy to be used for routine clinical diagnostics (like a standard biopsy). It will take several years to streamline the tech for point-of-care hospital pathology labs.
What Most People Miss
The integration of Spatial Multi-Omics.
Transcriptomics (mapping RNA) only tells you what the cell is planning to do. It does not guarantee that the cell actually built the protein it was planning to build.
What the industry is aggressively pushing toward is “Spatial Multi-Omics.” This involves overlaying the spatial RNA map (Transcriptomics) directly on top of a spatial protein map (Proteomics) and a spatial metabolism map (Metabolomics) from the exact same tissue slice. By stacking these massive datasets, scientists can see the entire biological cascade: the gene firing, the protein being built, and the resulting chemical exhaust, creating an absolute, irrefutable blueprint of human disease.
Comparison Table
| Feature | Bulk RNA Sequencing | Single-Cell RNA-Seq (scRNA-seq) | Spatial Transcriptomics (ST) |
| Tissue State | Destroyed / Homogenized | Destroyed / Dissociated | Intact / Preserved |
| Spatial Context | None (Average of all cells) | None (Individual cells, random order) | Complete X,Y Coordinates |
| Resolution | Low (Mixed signal) | High (Single cell) | Moderate to High (Approaching single-cell) |
| Primary Use Case | Broad biomarker discovery | Cellular heterogeneity analysis | Tumor Microenvironment mapping |
| Data Complexity | Low | High | Extreme (Requires heavy spatial algorithms) |
Case Study
Situation: A pharmaceutical company developed a novel immunotherapy designed to activate CD8+ T-cells to attack solid melanoma tumors. In pre-clinical bulk sequencing, the drug successfully increased T-cell activation markers. However, in human trials, the tumors continued to grow, baffling researchers.
Challenge: Bulk and single-cell sequencing confirmed that the T-cells were present and activated, but could not explain why they were failing to shrink the tumor mass.
Solution (The Spatial Pivot): The researchers applied spatial transcriptomics to biopsies of the non-responding tumors. The spatial maps generated a massive revelation: the active T-cells were not inside the tumor.
Outcome: The ST map showed a dense ring of specialized fibroblasts (called Cancer-Associated Fibroblasts, or CAFs) expressing specific exclusion genes directly around the outer border of the tumor. The activated T-cells were physically trapped outside this ring, completely unable to touch the cancer cells.
Lessons Learned: The case study proved that immune activation is useless without immune infiltration. By identifying the exact spatial location and gene signature of the barrier fibroblasts, the company pivoted their pipeline to develop a bi-specific antibody—one that first neutralizes the barrier cells, opening the gates for the activated T-cells to flood the tumor core.
Future Outlook
Next 12–24 Months
The era of FFPE Democratization. Formalin-Fixed Paraffin-Embedded (FFPE) tissues are the standard method hospitals use to store biopsies, but the chemicals historically degraded RNA too much for spatial mapping. Recent breakthroughs have finally optimized spatial chemistry for FFPE samples. Over the next two years, researchers will unleash ST on decades worth of archived clinical tumor samples sitting in hospital basements, unlocking a massive treasure trove of retrospective spatial data.
Next 3–5 Years
The achievement of True Single-Cell Whole-Transcriptome Mapping. The current trade-off between resolution and scale will collapse. Next-generation spatial arrays with sub-micron barcode grids will allow researchers to sequence the entire transcriptome of massive tissue slices at absolute single-cell resolution. This will trigger a surge in AI spatial pathology, where machine learning algorithms automatically diagnose tumors based on their spatial gene signatures faster and more accurately than a human pathologist.
Next 10 Years
The transition to Real-Time Clinical Diagnostics. By the mid-2030s, the hardware will miniaturize and the bioinformatics pipelines will become entirely cloud-automated. Spatial transcriptomics will migrate from the R&D lab to the surgical operating room. A surgeon will remove a tumor, run a rapid spatial multi-omic scan in hours, and the AI will print out a customized, spatially-informed combination drug regimen tailored exactly to the unique micro-geography of that specific patient’s cancer.
Most Likely Scenario
Spatial transcriptomics is executing the exact same hyper-growth curve that single-cell sequencing achieved a decade ago. It will rapidly become the mandatory baseline standard for all oncology and neurobiology research. Any pharmaceutical company attempting to push a solid-tumor drug through the FDA without robust spatial TME mapping will be considered operating in the dark.
Key Takeaways
- Traditional genomic sequencing destroys tissue to extract RNA, meaning scientists know what genes are active but lose the critical map of where they were located.
- Spatial transcriptomics solves this by using chemical barcodes and high-resolution imaging to map exactly where RNA molecules are firing inside an intact tissue slice.
- The technology is crucial for fighting cancer because it maps the Tumor Microenvironment (TME), revealing how cancer cells build physical and chemical walls to trap immune cells.
- The industry is split between NGS-based methods (capturing all genes at moderate resolution) and imaging-based FISH methods (capturing fewer genes at extreme single-cell resolution).
- The massive amount of spatial data generated is shifting the bottleneck of biotech away from lab chemistry and toward cloud computing, AI, and advanced bioinformatics.
- Spatial multi-omics—layering RNA, proteins, and metabolism on the same 3D map—is the ultimate frontier of precision medicine.
Glossary
Bulk RNA Sequencing: The traditional method of grinding up an entire tissue sample to sequence the RNA, providing an average gene expression profile but zero spatial context.
Cancer-Associated Fibroblasts (CAFs): Cells within the tumor microenvironment that cancer cells hijack to build protective physical barriers and suppress the immune system.
FFPE (Formalin-Fixed Paraffin-Embedded): The standard chemical method hospitals use to preserve and store tissue biopsies at room temperature for decades.
MERFISH (Multiplexed Error-Robust Fluorescence in situ Hybridization): An advanced imaging-based spatial technology that uses fluorescent probes to light up and map specific RNA molecules directly inside intact cells.
Single-Cell RNA Sequencing (scRNA-seq): A method that isolates individual cells to sequence their RNA, revealing cellular differences but destroying the original tissue architecture.
Spatial Barcode: A unique synthetic DNA sequence printed on a microscopic array dot that serves as a physical X,Y coordinate tag for the RNA that lands on it.
Tumor Microenvironment (TME): The complex, localized ecosystem of blood vessels, immune cells, and signaling molecules that physically surrounds and interacts with a tumor.
Sources
[1] Nature Methods: Method of the Year: Spatially resolved transcriptomics (2020)
[2] 10x Genomics: Visium Spatial Gene Expression and CytAssist Technology Updates (2025)
[3] Bruker / NanoString Technologies: CosMx Spatial Molecular Imager and High-Plex RNA Mapping
[4] Cell: Spatial transcriptomics reveals the architecture of the tumor microenvironment (2025/2026 Reviews)
[5] Science: Spatially resolved multi-omics for precision medicine in oncology