Advertisement
)

At a Glance
- Concept: Remote sensing technology that captures the entire continuous electromagnetic spectrum for every pixel in an image, creating a unique “chemical fingerprint” for objects on the ground.
- Why it matters: Traditional satellites can tell you where an object is. Hyperspectral satellites tell you what it is made of. This is the core technology driving the detection of industrial greenhouse gases, identifying diseased crops before they wither, and unmasking enemy military decoys.
- Who uses it: Intelligence agencies, agricultural technology (AgTech) investors, and climate regulators enforcing carbon border taxes.
- Biggest takeaway: Hyperspectral imaging fundamentally suffers from a Signal-to-Noise Ratio (SNR) problem. Because the light is sliced into hundreds of microscopic bands, modern satellites must use advanced physical maneuvers—like “back-nodding”—to stare at a target longer just to gather enough photons to read the chemical signature.
In Simple Words
Imagine you are looking at an incredibly complex orchestral chord being played on a piano.
The human eye, and standard satellite cameras, only have three massive piano keys: Red, Green, and Blue. If a complex chord is played, standard cameras just mash those three broad keys together to give you an estimated, blended color.
“Multispectral” satellites upgrade the piano to 10 keys. They can hear a few more specific notes, like Near-Infrared, which is great for seeing general forest health, but they still miss the fine details of the chord.
Hyperspectral satellites have all 88 keys on the piano, perfectly tuned. They do not just see a broad “green” band; they see 50 different micro-shades of green. Because every chemical element on Earth absorbs and reflects light in a highly specific, unique pattern across those 88 keys, the satellite can read the visual “chord” perfectly. It allows an analyst in a control room to look at a green pixel and say definitively: “That is not a green oak tree; that is canvas fabric painted with green polyurethane.”
Why This Matters
For decades, the commercial space industry was obsessed with spatial resolution—how sharp the image was. Companies raced to build cameras that could read a license plate from low Earth orbit. However, spatial resolution has hit regulatory and physical limits. The new space race is entirely about spectral resolution.
The global hyperspectral satellite market reached USD 4.8 billion in 2025 and is projected to expand at an 11.8% compound annual growth rate to USD 12.6 billion by 2034.
This massive capital influx is driven by the urgent need for absolute planetary telemetry. In August 2024, Planet launched Tanager-1, a breakthrough hyperspectral satellite built in partnership with NASA JPL and the Carbon Mapper Coalition. By 2025 and 2026, Tanager-1 had successfully detected thousands of invisible methane and carbon dioxide plumes leaking from oil and gas facilities globally. Without hyperspectral technology, these super-emitters remain entirely invisible. The ability to autonomously identify specific minerals, detect pipeline leaks, and analyze soil chemistry from space transitions the satellite industry from taking simple photographs into generating actionable, molecular-level intelligence.
The Big Picture
The foundation of hyperspectral imaging is the Electromagnetic Spectrum.
Human vision is restricted to a tiny sliver of light between 400 and 700 nanometers (nm). Most of the universe’s chemical information is hidden in the spectrums we cannot see, specifically the Visible and Near-Infrared (VNIR) and the Short-Wave Infrared (SWIR) bands.
Every material interacts with the Sun’s light differently. A specific mineral might reflect red light perfectly but completely absorb light at exactly 2300 nm. If a satellite can measure that exact dip at 2300 nm, it confirms the presence of that mineral. This unique reflection pattern is called a Spectral Signature.
HOW HYPERSPECTRAL SATELLITES WORK
Capturing a chemical signature from an object 500 kilometers below while traveling at 28,000 kilometers per hour requires mastering the physics of optics.
1. The Fundamental Problem: Broad-Band Blindness
To identify a chemical, you must isolate the exact nanometer wavelength where its molecular bonds absorb light. Standard optical cameras use wide filters that let broad chunks of light in at once. This washes out the specific, narrow absorption dips, blinding the sensor to the chemical reality on the ground.
2. The Insufficiency of Multispectral Imaging
Legacy remote sensing relied on Multispectral imaging (like the Landsat or Sentinel-2 programs). Multispectral sensors capture 5 to 15 distinct, widely spaced bands. While highly useful for tracking broad land-use changes, a multispectral sensor completely jumps over the tiny, 5-nanometer-wide absorption lines required to definitively identify specific gases or rare earth minerals.
3. The Core Mechanism: The Imaging Spectrometer
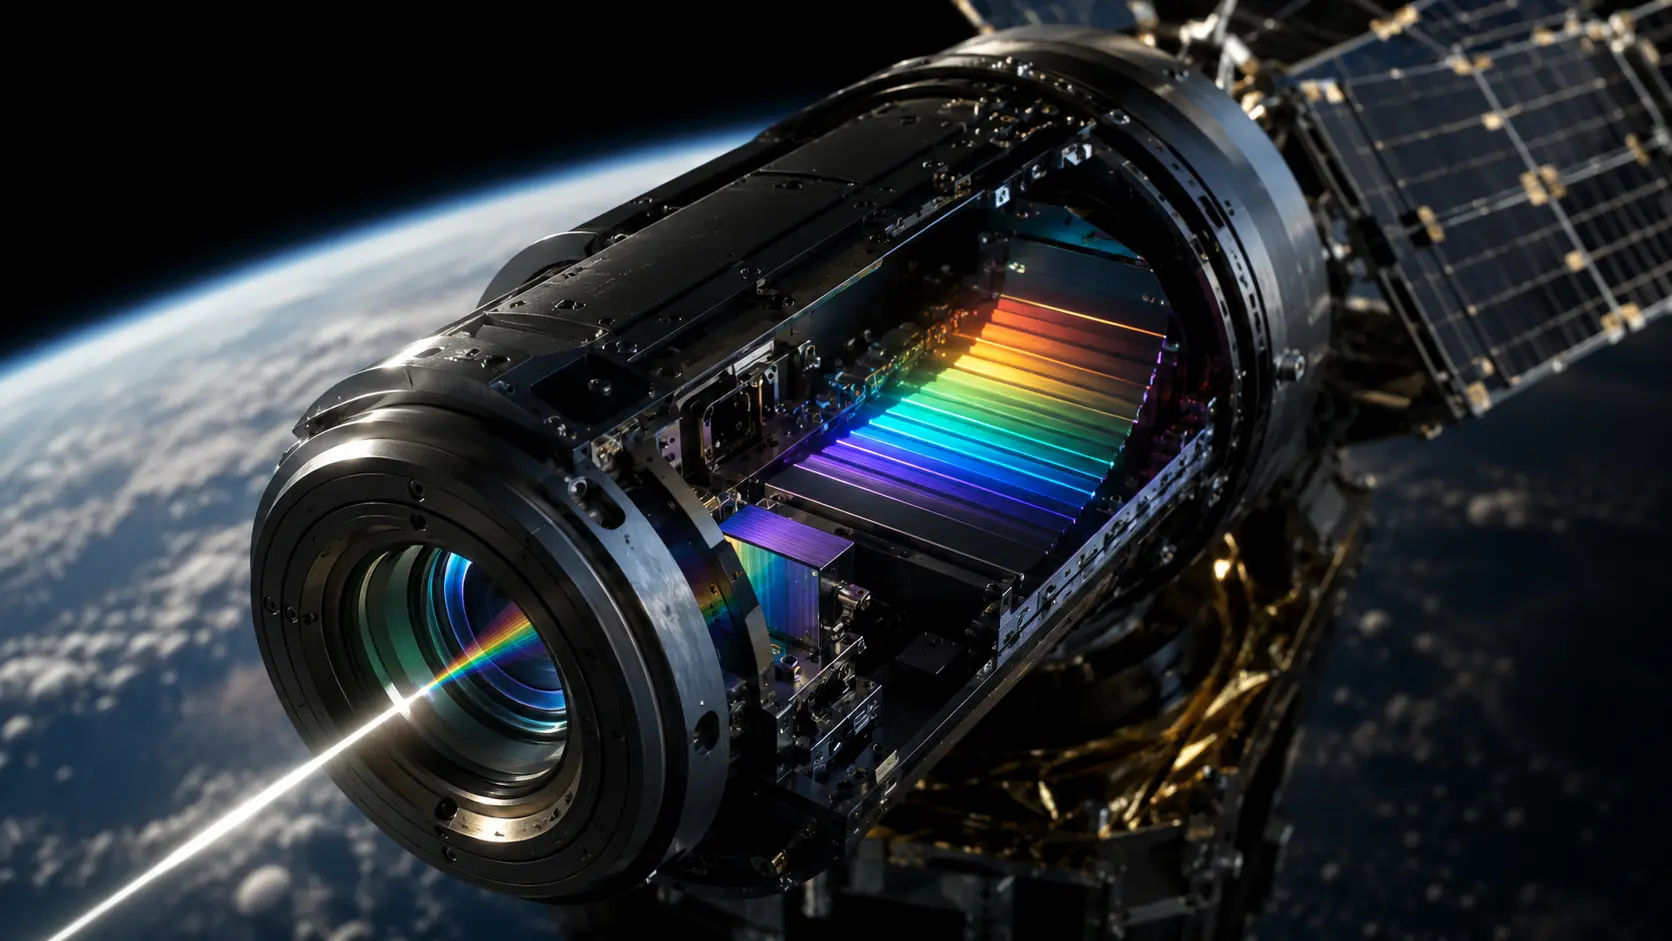
Hyperspectral satellites replace basic camera filters with an Imaging Spectrometer. Light from the Earth passes through a telescope and enters a microscopic slit. It then hits a diffraction grating (such as a Dyson-form spectrometer), which physically shatters the light into a continuous rainbow. The sensor reads this continuous spectrum in hundreds of extremely narrow, contiguous bands. For example, the Tanager satellites capture approximately 426 bands with 5 nm spacing across the 380 to 2500 nm range.
4. Technical Depth: The Data Cube and Back-Nodding
The sensor generates a massive 3D file known as a Data Cube. Two dimensions represent the physical X and Y coordinates on the ground, while the third dimension (Z) represents the hundreds of spectral bands for each pixel.
Because the light is sliced so thinly, very few photons hit the detector for any given band. This causes a low Signal-to-Noise Ratio (SNR), making the image grainy. To solve this, satellites like Tanager execute a maneuver called “back-nodding”. As the satellite flies forward, it uses its reaction wheels to physically pitch its nose backward, effectively “staring” at the exact same patch of ground for a longer duration (e.g., 32 milliseconds instead of 8). This increases the photon capture drastically without suffering from “pixel stretching,” ensuring crisp, chemically accurate data.
5. Real-World Consequences: Dimensionality Reduction
The curse of hyperspectral imaging is data volume. A single uncompressed Data Cube can exceed tens of gigabytes. Beaming this raw data down to Earth chokes the satellite’s radio downlink. Therefore, hyperspectral systems rely heavily on complex onboard processing. Space-hardened computers use Principal Component Analysis (PCA) and dimensionality reduction algorithms to strip out redundant bands in orbit, transmitting only the critical anomalies down to the ground stations.
Real-World Applications
The deployment of commercial hyperspectral constellations provides immediate tactical value across multiple industries.
Sovereign Intelligence and Defense: Distinguishing reality from deception is critical in modern warfare. In 2025 and 2026, the Finnish startup Kuva Space partnered with Japanese heavy-industry giant IHI to evaluate sovereign hyperspectral constellations for national security. Hyperspectral data instantly highlights the chemical difference between a real rubber tree and a rubber decoy tank hidden in a forest, rendering traditional visual camouflage entirely obsolete.
Greenhouse Gas Mitigation: Methane is a potent greenhouse gas that is completely invisible to standard cameras. Satellites like Tanager-1 are explicitly tuned to target the 2300 nm absorption feature of methane. By mapping a 30-meter resolution pixel directly to a leaking pipeline valve, environmental agencies can pinpoint the exact geographic coordinates of commercial super-emitters worldwide, transitioning climate policy from estimation to hard enforcement.
Precision Agriculture and Resource Security: The agriculture sector accounted for the largest regional market share in the Asia Pacific by 2025, driven by the need to guarantee food security. Hyperspectral imagery detects subtle changes in leaf chlorophyll and moisture content weeks before the human eye can see a plant wilting. Startups like Pixxel deployed constellations offering 5-meter spatial resolution with 300 spectral bands, allowing agronomists to optimize fertilizer inputs and precisely predict crop yields on a continental scale.
Economic & Strategic Impact
The democratization of hyperspectral technology destroys the monopoly of state-sponsored space agencies.
Historically, launching an imaging spectrometer required a multi-billion dollar NASA or ESA platform (like the PRISMA or EnMAP missions). Today, commercial constellations use modular, miniaturized optical blocks fitted inside agile microsatellites. The barrier to entry has plummeted.
Strategically, the availability of daily, global chemical telemetry alters international trade compliance. As the European Union rolls out the Carbon Border Adjustment Mechanism (CBAM), importing nations must audit the exact carbon footprint of foreign industrial facilities. Hyperspectral satellites act as an unblinking, un-bribable global auditor. You cannot hide an active, high-emission coal plant or an illegal mining operation if commercial satellites pass overhead daily, mapping the chemical exhaust plumes in real-time.
Advantages
- Absolute Material Identification: Moves beyond spatial object detection (finding a shape) to definitive molecular classification (proving what the shape is made of).
- Passive Stealth Sensing: Unlike Synthetic Aperture Radar (SAR) which blasts radio waves at the Earth, hyperspectral sensors are entirely passive. They only collect bouncing sunlight, making the satellite’s operation undetectable to adversaries on the ground.
- Sub-Pixel Target Detection: Analysts can find target materials that are smaller than the actual pixel size. Using spectral unmixing algorithms, they can identify the specific signature of a rare mineral even if it only covers 10% of a 30-meter pixel.
Limitations
- Atmospheric Interference: To see the ground, the satellite must look through the Earth’s atmosphere. Water vapor and aerosols severely absorb and distort light. Advanced “atmospheric correction” software is mandatory to strip away the atmosphere’s signature before the ground data is usable.
- The Weather Constraint: Because it relies entirely on reflected sunlight, a hyperspectral satellite is completely useless at night or when clouds cover the target area.
- Spatial vs. Spectral Trade-off: Physics limits the sensor. Slicing light into 400 narrow bands starves the detector of photons. To compensate, satellites must use larger pixels (e.g., 30 meters). Therefore, hyperspectral images are incredibly rich chemically, but visually “blurrier” than high-resolution 30-centimeter optical spy satellites.
Common Misconceptions
Misconception: Hyperspectral imaging can see through roofs and clouds.
Reality: It strictly measures light reflected off the top surface of an object. If a cloud or a warehouse roof blocks the sun, the satellite cannot see what is underneath it. Only Synthetic Aperture Radar (SAR) can penetrate cloud cover.
Misconception: More spectral bands always equal better data.
Reality: Beyond a certain point, capturing more bands just adds noise and data processing weight without providing new chemical insights. The key to high-quality intelligence is high Signal-to-Noise Ratio (SNR) in the correct bands, not simply the maximum number of bands.
Misconception: Multispectral and hyperspectral are the same thing.
Reality: Multispectral takes a few broad, disconnected samples of the spectrum. Hyperspectral takes hundreds of narrow, contiguous (touching) samples, ensuring that no chemical absorption lines slip through the cracks.
What Most People Miss
The hardware in space is useless without the Spectral Libraries on Earth.
To identify a chemical signature from orbit, the analyst must compare the satellite’s reading against a database of known materials. These databases (Spectral Libraries) require scientists on Earth to painstakingly measure thousands of soil types, paints, and minerals using handheld spectrometers in controlled laboratories. If a military adversary invents a completely new, classified stealth coating with a spectral signature that is not recorded in any Western database, the hyperspectral satellite will see it, but the software will not know what it is looking at. The intelligence value of the satellite is strictly limited by the comprehensiveness of the ground-truth library.
Comparison Table
| Feature | High-Res Optical (Panchromatic) | Multispectral Imaging | Hyperspectral Imaging |
| Spectral Bands | 1 (Grayscale) | 4 to 15 (Broad bands) | 100 to 500+ (Narrow, contiguous bands) |
| Primary Strength | Sharp, highly detailed shapes. | General land use, vegetation health. | Precise chemical and material identification. |
| Typical Spatial Resolution | 0.3m to 1m | 1m to 10m | 5m to 30m |
| Data Output | 2D Photograph | Stacked 2D Images | 3D Spectral Data Cube |
| Example Use Case | Counting cars in a parking lot. | Mapping deforestation borders. | Detecting an invisible methane leak from a specific pipe. |
Case Study
Situation: The global effort to combat climate change was severely hindered by a lack of primary data. Regulators knew that massive amounts of methane—a greenhouse gas 80 times more potent than CO2—were leaking from oil and gas infrastructure, but standard satellites could not see the invisible gas, and ground sensors were too localized.
Challenge: Mapping methane point-sources globally required a space-based sensor that could isolate the specific 2300 nm absorption signature of methane with high enough spatial resolution to pinpoint individual leaking facilities, without crippling the satellite with a low Signal-to-Noise Ratio.
Solution (The Coalition): The Carbon Mapper Coalition, a public-private partnership including NASA JPL, Planet Labs, and philanthropic backers, engineered the Tanager satellite constellation. On August 16, 2024, Planet launched Tanager-1 aboard a SpaceX Falcon 9 rocket. The satellite featured a JPL-designed Dyson-type imaging spectrometer capable of capturing 426 continuous bands at a 30-meter resolution.
Outcome: To achieve the necessary SNR, Tanager-1 utilized “Maximum Sensitivity” collection modes, performing extreme back-nodding to increase its exposure time over target sites by 400%. By its first operational year in 2025, Tanager-1 had successfully detected and quantified thousands of massive methane and CO2 plumes globally.
Lessons Learned: The deployment proved that philanthropic and commercial partnerships can successfully field exquisite, NASA-grade scientific instruments on agile commercial satellite buses. By isolating chemical signatures from space, the coalition turned invisible emissions into an actionable, publicly accountable map, directly forcing heavily polluting facilities to repair undetected leaks.
Future Outlook
Next 12–24 Months
The focus will strictly be on software and edge computing. As hyperspectral constellations from Pixxel and EarthDaily scale up their daily revisit rates in 2025 and 2026, the massive influx of raw Data Cubes will overwhelm traditional cloud processing. Satellite manufacturers will embed powerful neural processing units (NPUs) directly onto the spacecraft. These chips will run AI inference in orbit, identifying a methane leak or a military asset the second the image is taken, and instantly beaming down a tiny, 2-kilobyte text alert rather than a 10-gigabyte image file.
Next 3–5 Years
We will witness the widespread fusion of Hyperspectral and Synthetic Aperture Radar (SAR) data. Because hyperspectral is blinded by clouds, intelligence agencies will train multimodal AI models to overlay chemical maps (captured on clear days) perfectly with SAR topography maps (captured through cloud cover). This sensor fusion will provide continuous, 24/7 all-weather intelligence, effectively negating the inherent weaknesses of both technologies.
Next 10 Years
Hyperspectral sensors will shrink drastically and become ubiquitous across all autonomous platforms. High-altitude pseudo-satellites (HAPS) and long-endurance military drones will carry miniaturized hyperspectral payloads, providing persistent, localized chemical monitoring. In the commercial sector, the commoditization of spectral data will allow automated commodities trading bots to short-sell agricultural futures based on real-time, molecular-level crop stress data beamed from space milliseconds after a localized drought begins.
Most Likely Scenario
Hyperspectral imaging is completing its transition from a boutique scientific instrument into a foundational pillar of global intelligence and supply chain auditing. While spatial resolution will always be necessary for physical targeting, spectral resolution will govern macroeconomic and environmental policy. The nations and corporations that master the AI required to quickly parse and interpret these massive chemical data cubes will hold an insurmountable asymmetric advantage in geopolitical and resource forecasting.
Key Takeaways
- Hyperspectral satellites use imaging spectrometers to divide light into hundreds of narrow, continuous bands, capturing a 3D “Data Cube.”
- Every material on Earth absorbs and reflects light uniquely. Hyperspectral imaging captures this specific “spectral signature,” allowing analysts to determine the exact chemical makeup of a pixel.
- Because slicing light so thinly reduces the amount of photons hitting the sensor, advanced satellites must perform “back-nodding” maneuvers to stare at the target longer to improve image clarity.
- The technology is critical for national security (identifying camouflage and decoys) and environmental tracking (pinpointing invisible methane and CO2 leaks).
- The global hyperspectral market, driven by constellations from companies like Planet, Pixxel, and Kuva Space, reached USD 4.8 billion in 2025 and is expanding rapidly.
- Hyperspectral imaging cannot see through clouds or work at night, and its intelligence value relies heavily on having accurate Earth-based “Spectral Libraries” to cross-reference against.
Glossary
Back-Nodding: A physical orbital maneuver where a satellite pitches its nose backward to counter its forward velocity, effectively hovering its sensor over a specific target longer to gather more light.
Data Cube: The 3D file generated by a hyperspectral sensor, consisting of two spatial dimensions (X and Y coordinates) and one spectral dimension (the hundreds of wavelength bands).
Diffraction Grating: An optical component with a periodic structure that splits and diffracts light into several beams traveling in different directions, acting like a highly precise prism.
Principal Component Analysis (PCA): A mathematical algorithm used to reduce the dimensionality of large datasets, heavily utilized in space to compress massive hyperspectral files by stripping out redundant data.
Signal-to-Noise Ratio (SNR): A measure used to compare the level of a desired signal (actual light reflecting off a target) to the level of background noise; critical for accurate chemical identification.
Spectral Signature: The specific, unique pattern of light absorption and reflection across the electromagnetic spectrum that defines a particular material or chemical compound.
SWIR (Short-Wave Infrared): The region of the electromagnetic spectrum typically between 1000 nm and 2500 nm, invisible to the human eye, where many critical minerals and gases (like methane) exhibit distinct absorption features.
Frequently Asked Questions
Can hyperspectral satellites read text on a document from space?
No. Reading text requires extreme spatial resolution (sub-10-centimeter clarity). Hyperspectral satellites trade spatial sharpness for chemical depth, typically operating at resolutions of 5 to 30 meters per pixel. They can tell you the paper’s exact chemical makeup, but they cannot read the ink on it.
Why don’t all satellites use hyperspectral sensors?
Data volume and cost. Building a Dyson spectrometer is incredibly expensive and complex. Furthermore, the massive 3D data cubes they generate require highly specialized, expensive software pipelines to process and massive radio bandwidth to beam down to Earth.
How is this different from thermal imaging?
Thermal imaging (Long-Wave Infrared or LWIR) specifically detects the heat emitted by an object. Hyperspectral imaging (in the VNIR and SWIR ranges) primarily detects the sunlight reflected off an object.
Do these satellites emit radiation or lasers to scan the ground?
No. Hyperspectral imaging is entirely passive. The satellite simply opens its shutter and collects the sunlight bouncing off the Earth, making it completely undetectable to anti-satellite monitoring systems on the ground.
How does atmospheric correction work?
Because the Earth’s atmosphere is full of water vapor and scattering particles, it alters the light before it reaches the satellite in space. Engineers use complex physics models to mathematically subtract the exact distortion caused by the atmosphere on that specific day, revealing the true chemical signature of the ground below.
Sources
- Dataintelo: Hyperspectral Satellite Market Research Report 2033
- Planet Documentation: Tanager Hyperspectral Satellite Constellation Operations
- European Space Agency (ESA): Tanager-1: First Year Results of Hyperspectral Imaging for Greenhouse Gas Plume Detection
- ArcticStartup: Finnish Kuva Space partners with Japan’s IHI to assess sovereign hyperspectral satellite constellation
- eoPortal: Pixxel Hyperspectral Imaging Constellation